


Dr. Hugh Cutcher
March 10, 2025
Share this post
Note: This forecast was issued on March 7 at 1200 UTC. This article was originally published on PV magazine global on March 7.
Eastern Australia's photovoltaic power generation is poised to experience significant disruptions as Tropical Cyclone Alfred approaches landfall in southeast Queensland, according to analysis using the Solcast API, and forecasts issued Friday morning. The cyclone's trajectory is expected to bring extensive cloud cover and rainfall to key solar-producing regions, notably southeast Queensland and Coastal New South Wales (NSW). The majority of the solar impact will be felt near the core of the system, whilst areas further away may benefit from enhanced solar irradiance due to stabilizing atmospheric conditions on the cyclone's periphery. However, the inherent unpredictability of tropical cyclones means that forecasts and potential impacts can change as the situation develops.
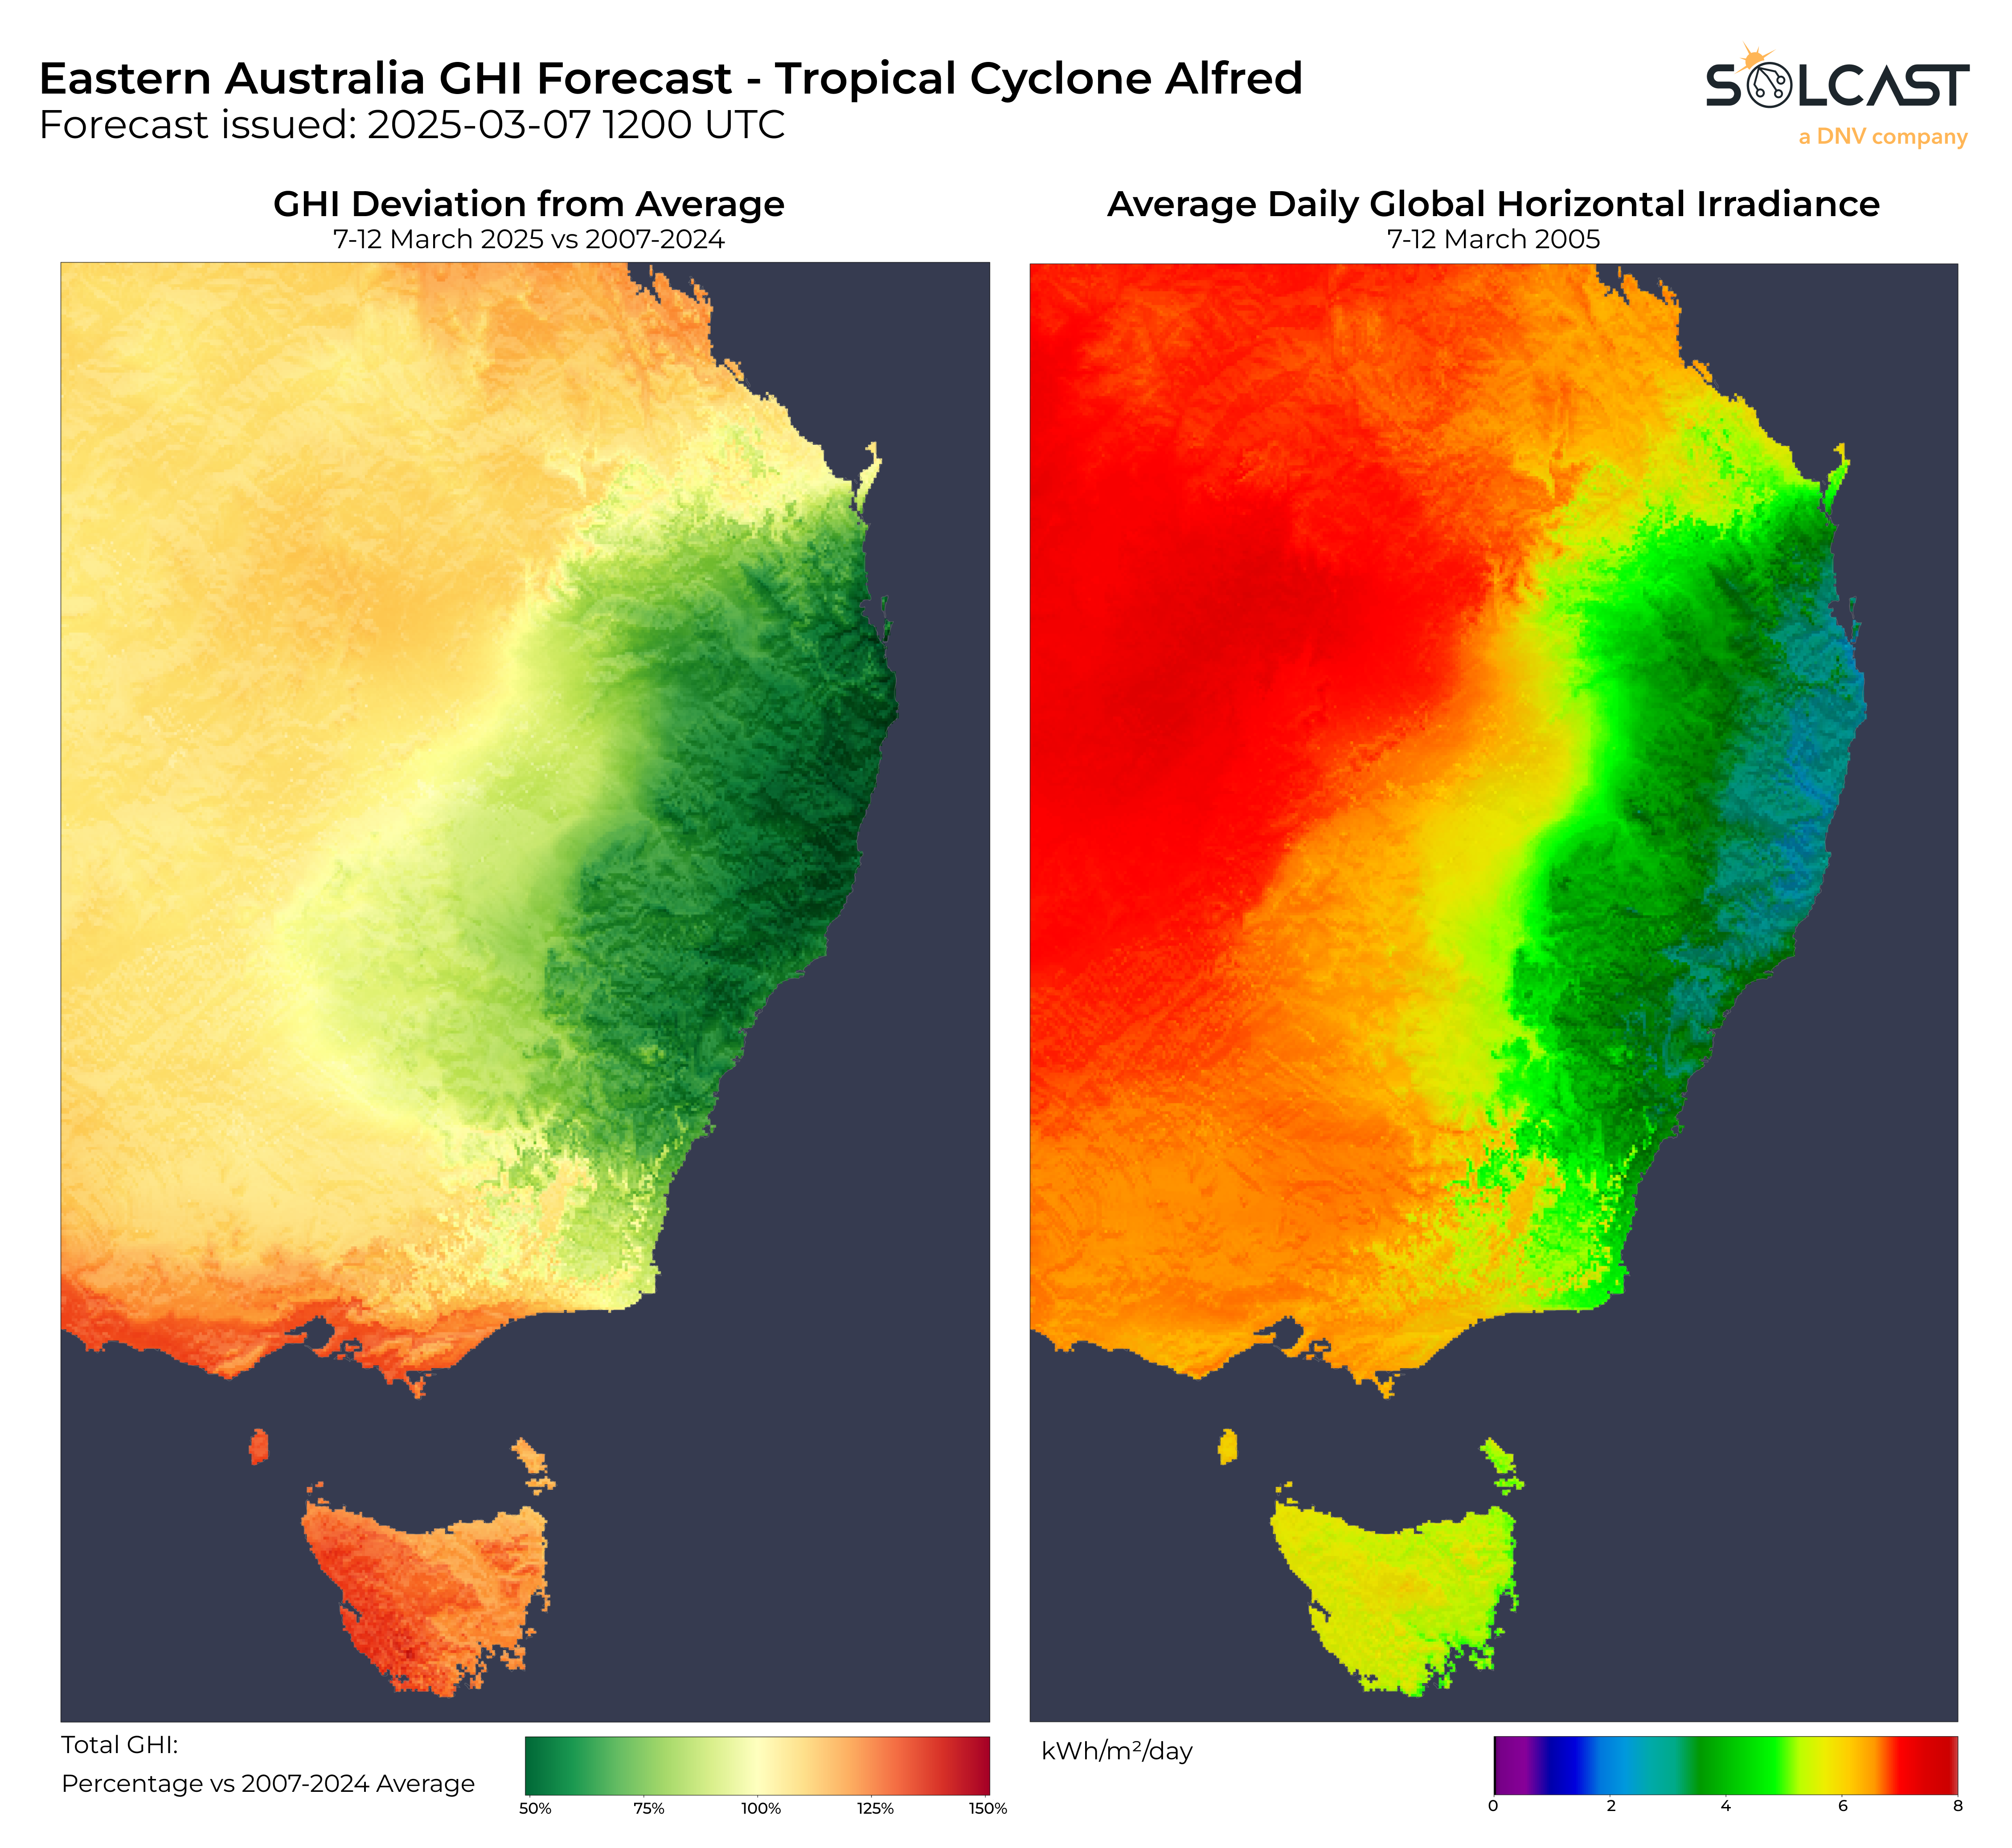
At the time of writing, Tropical Cyclone Alfred, currently a Category 2 system, was forecast to make landfall between Double Island Point and Noosa, just south of Brisbane's central business district, on Saturday morning. As it progresses inland, the cyclone is expected to weaken but will continue to deliver substantial cloud cover and rain across southeast Queensland and coastal NSW over the coming days. As the storm moves inland, irradiance levels are forecast to be 30-50% below the long-term average for the period 7 to 12 March. Areas most impacted will see mean daily irradiance dropping below 2.5 kWh during this five-day span.
Reduced irradiance from this storm will drop PV production across the most populated parts of the country. For instance, aggregated behind-the-meter power for Energex, the distributor serving greater Brisbane, is forecast to be 46% below average over the next five days. Additionally, potential damage to solar assets and power infrastructure from strong winds and flooding could impact power production in the short to medium term. On a broader scale, total aggregated solar generation for Queensland and NSW is projected to be approximately 30% below average for this time of year, especially important given the significant proportion of PV generation capacity within the affected zones. Sydney is also likely to experience the effects of cloud cover associated with system post-landfall, with behind-the-meter production anticipated to be 33% below average.
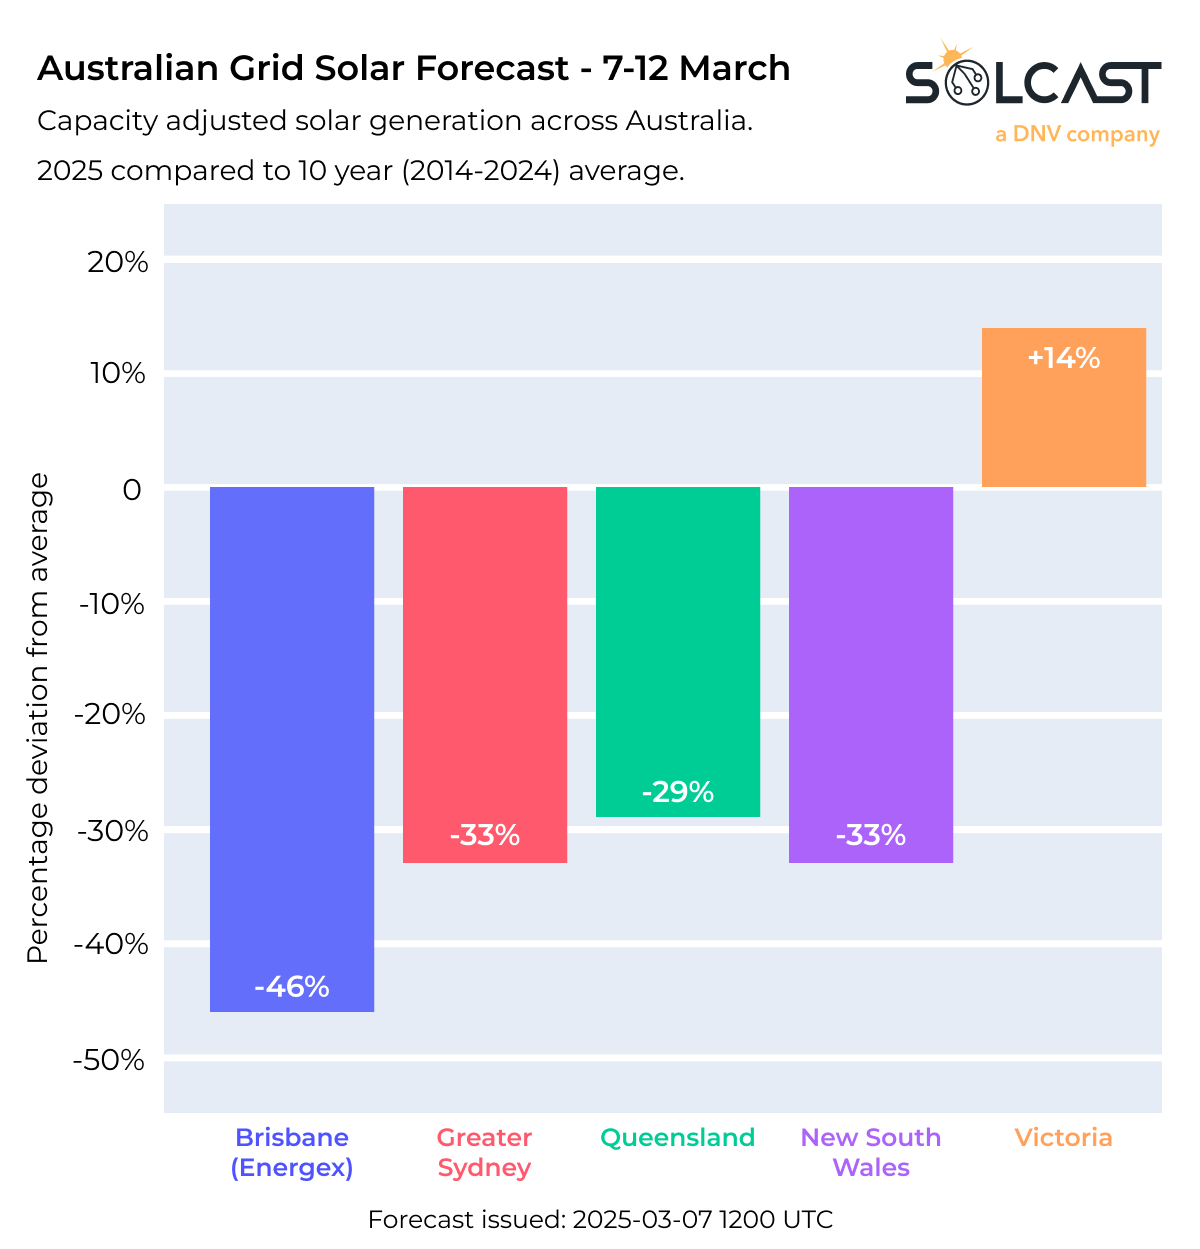
In contrast, some areas further from Alfred’s path are expected to encounter favorable conditions for PV power production. Those parts of southeast Australia may experience irradiance levels more than 10% above average from March 7 to 12. Notably, parts of Victoria and Tasmania could see irradiance 20% above average, with PV power generation in Victoria projected to be 14% above average. This phenomenon occurs because a tropical cyclone lifts large amounts of air into the upper atmosphere within the clouds in its core. That air descends outside the cyclone, suppressing cloud formation and enhancing solar irradiance around the system.
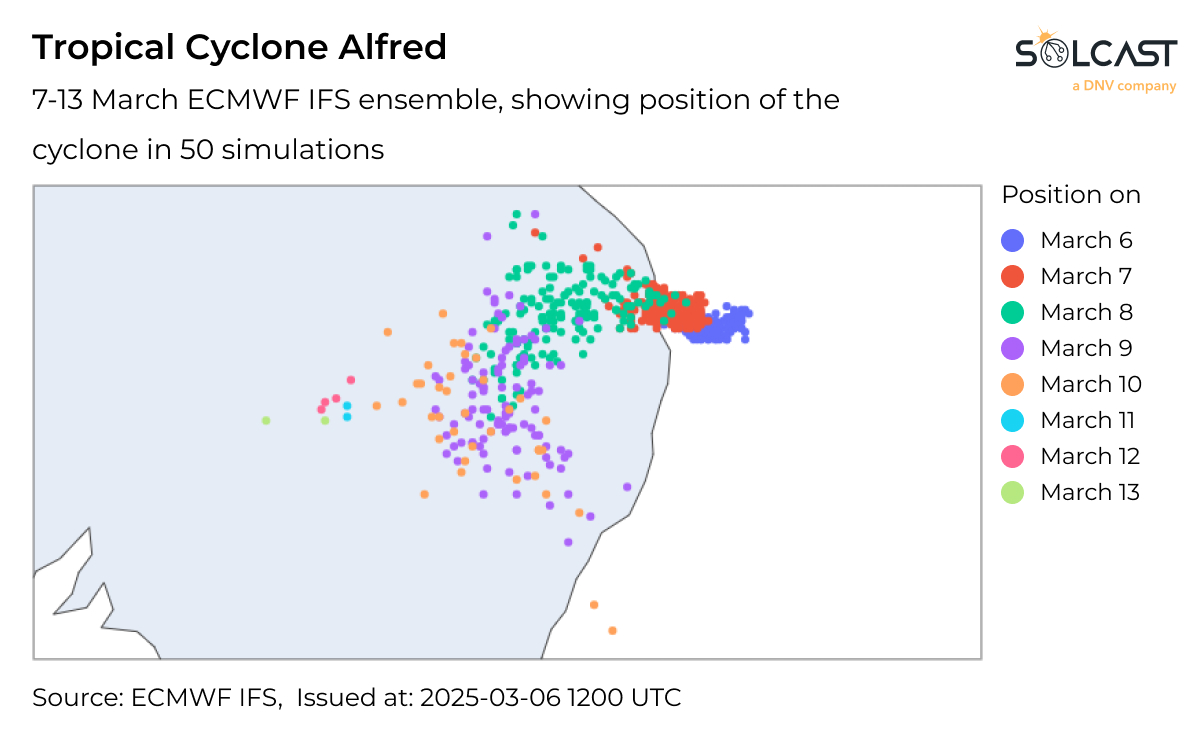
It's important to note that forecasting tropical cyclones involves considerable uncertainty due to the complex interactions within these systems. Despite advancements in weather prediction technology, there remains a range of possible outcomes, and forecasts can be subject to change. For example, ensemble forecasts from the European Centre for Medium-Range Weather Forecasts (ECMWF) exhibit a spread of scenarios over the next week, ranging from tracks curving back into the Tasman Sea to paths extending into Australia's interior. This variability underscores the necessity for individuals and organizations in threatened areas to stay in touch with the latest weather information and advice from local emergency services. While irradiance impacts at specific locations are subject to significant uncertainty, forecasts aggregated over larger areas, such as entire states, are less sensitive to exact cloud cover locations, providing a more reliable outlook for overall PV production.
Track weather conditions, cloud movements, and irradiance-influencing factors that impact your solar generation. Access bankable actuals and accurate forecasts when you sign up for a Solcast API toolkit. You can reach out to our team for an extended trial.